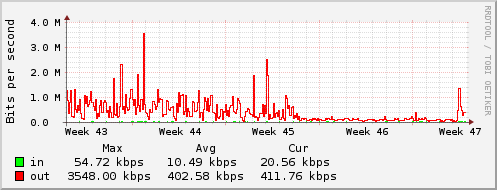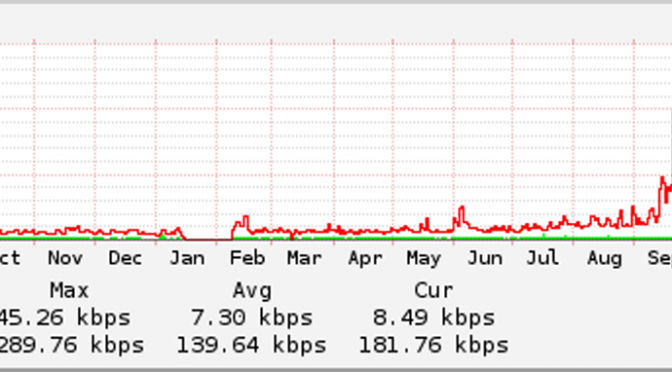
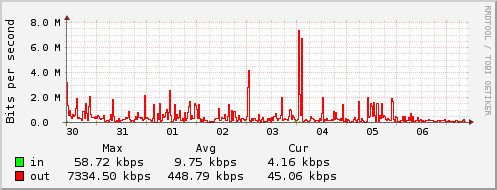
I’ve recently been investigating some curious behaviour that has been going on on a server I administer. This is a VM hosted with Mythic Beasts, and it hosts a variety of sites, several of which use WordPress (like this!) – the specific problem I’ve seen is a large bandwidth increase over a couple of months. The following chart demonstrates:
Now, the usage levels are still well inside my allowed totals, but I decided to have a look – I know a couple of the sites are reasonably popular ones, and they could have had a surge in activity, but the figures are more interesting.
As it turned out, after totting up totals by vhost, the vast majority of the bandwidth was going on one site. In a 2 week period, 95% of the bandwidth was serving one vhost at about 6GB a day. More curiously, this vhost (running a fully patched WP instance) has of the order of 500 hits a day over this period. While there are some wonderful images on this site, and several per post, there’s should be nowhere near this amount of data. What makes it more confusing is that Jetpack was installed, and had Photon enabled.
Photon is the free service from WordPress that allows serving of images from a content delivery network (CDN), which is designed to take load (really bandwidth as images are simple to serve) away from the source server. Having done a little digging in the logs, it turns out there were entries like this:
192.0.86.129 - - [01/Nov/2015:03:40:11 +0000] 'GET /wp-content/uploads/2014/11/IMG_1667.jpg HTTP/1.1' 200 500600 '-' 'Photon/1.0'

192.0.86.185 - - [01/Nov/2015:03:40:17 +0000] 'GET /wp-content/uploads/2014/11/IMG_1667.jpg HTTP/1.1' 200 500600 '-' 'Photon/1.0'

192.0.86.162 - - [01/Nov/2015:03:40:20 +0000] 'GET /wp-content/uploads/2014/11/IMG_1667.jpg HTTP/1.1' 200 500600 '-' 'Photon/1.0'
<snip another 140 similar lines…>
192.0.86.143 - - [01/Nov/2015:03:47:35 +0000] 'GET /wp-content/uploads/2014/11/IMG_1667.jpg HTTP/1.1' 200 500600 '-' 'Photon/1.0'

192.0.86.125 - - [01/Nov/2015:03:47:38 +0000] 'GET /wp-content/uploads/2014/11/IMG_1667.jpg HTTP/1.1' 200 500600 '-' 'Photon/1.0'
So, 145 requests for the same file within 7 minutes – what on earth? CDN are supposed to cache to avoid rerequesting data like this. More confusing is that there just weren’t this number of page requests in this period – in fact there were only 18 requests for feeds or posts… Across 2 weeks in this single vhost, total traffic was 82GB, with 73GB of images being served to Photon alone – and there’s only 2GB of data on disc for the vhost, including code!
So, after raising a support call with Jetpack (and have to say the support staff were helpful and responsive here), I got a little way to working out what it was doing.
When Photon gets a request for a file it doesn’t have, it requests the full size image from the source blog, which is fine. Photon also does resizing/optimization of images when the image requested has relevant GET parameters (eg w, h, resize, etc) – here it does the same thing in that it re-requests the full size image and resizes it.
Though confirmed that this is the expected behaviour by the Devs, I think this is a design flaw. Photon already stores the images forever (if you want to change an image, you must change the filename – that’s documented) and it would make sense to retain the original and use this for resizing appropriately when it needs to. Even as is, you’d expect the images in use to get cached up and then be served from CDN so you should reasonably quickly build up all the sizes you need in cache.
So what about the 145 requests? Well, after being sent the logs by Jetpack support, it’s clear that there are a load of individual requests for the same image with different sizes, eg:
i2.wp.com - - - - [01/Nov/2015:03:40:39 +0000] GET /XXX/wp-content/uploads/2014/11/IMG_1667.jpg?zoom=2&resize=523%2C512 HTTP/1.1 <REFERER>

i2.wp.com - - - - [01/Nov/2015:03:40:42 +0000] GET /XXX/wp-content/uploads/2014/11/IMG_1667.jpg?zoom=2&resize=519%2C508 HTTP/1.1 <REFERER>

i2.wp.com - - - - [01/Nov/2015:03:40:45 +0000] GET /XXX/wp-content/uploads/2014/11/IMG_1667.jpg?zoom=2&resize=515%2C504 HTTP/1.1 <REFERER></code>
And so on, all the way down to a resize request with size 61 x 50px… So, this is expected behaviour, but (despite the referrer looking right) these image requests don’t appear to be from pages that are WP generated. I’m not sure really how and where these are being generated – are they bots, apps, scrapes, feeds? Hard to know, as I don’t have the full details, but it’s hugely inefficient once Photon starts dealing with those requests. This is by no means the worst – from the last 2 weeks:
# zgrep "Photon" site-access.log.* | grep "/wp-content/uploads/2015/08/imagename.jpg" | wc -l
5484
Ouch.
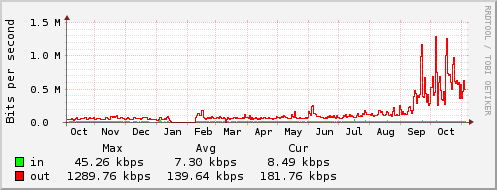
So, my current approach is to stop serving images in this way for this site – I can’t block it entirely, since you need Photon to serve image grids, etc, but after a day it looks to be going in the right direction (see the flat, non peaky graph in the last day):
I’d be interested if anyone else has seen similar behaviour – please leave comments!
Disappointingly, Jetpack say there’s no plans to change this behaviour, so for me this rules out its use on this size of site. It clearly does save bandwidth for normal requests, but it’s had a negative impact here – I could see it working for much larger image heavy sites, even with the frequent re-requests, but it’s just not working here.
EDIT 18-Nov-2015:
Point proved? (There was a popular post today which accounts for the late blip!)